Title: View of the wharf at Nyholm with the crane and some warships
Creator: Christoffer Wilhelm Eckersberg
Creator Lifespan: 1783 - 1853
Creator Nationality: Danish
Creator Gender: Male
Creator Death Place: Copenhagen
Creator Birth Place: Blåkrog, Åbenrå
Date Created: 1826
Physical Dimensions: w32.4 x h19.6 cm
Type: Painting
本篇基于上一篇python爬取拉勾职位信息文章中爬取到的拉勾的职位信息进行数据清洗,最后进行数据可视化分析
需求
爬取数据只是第一步,真正的需求是对数据进行分析,得到我们想要的信息。在本次任务中,我想获取到成都的机器学习算法岗位的相关的分析:
- 薪资的分布情况
- 薪资与区域分布
- 薪资与学历关系
- 薪资与工作年限关系
- 提供岗位的吸睛点
- 岗位的共性要求
问题
从上篇的获取到的数据来看,数据中存在影响本次分析的成分:
- 实习岗位,薪资明显和正式岗位差距很大,不符合我的需求
- 岗位薪资为区间,不便于进行数据分析展示
- 工作年限有数字区间、应届生、不限等不统一格式
- 其他数字字符混合的数据
- 岗位要求数据格式混乱,标号不统一
解决方案
针对以上问题,先进行数据清洗:
- 删除实习岗位
- 薪资取区间的前25%,比较符合实际,也便于进行数据分析
- 工作年限取区间中值,应届生、不限和其他均取0值
- 规模取区间中值
- 数据分析的时候对岗位要求删除标号、空格等特殊字符
代码实现与结果
数据清洗部分解析
1
2
3
4
import pandas as pd

file_name = "机器学习算法_成都.csv"
data = pd.read_csv(file_name)
- 删除实习岗位
1
data.drop(data[data["职位"].str.contains("实习")].index, inplace=True)  # 删除实习岗位
- 工资数据清洗:先把string类型转为数字类型,再取区间的前25%为当前职位的薪资
1
2
3
4
5
6
7
8
9
reg_num = '\\d+'  # 匹配数字正则表达式(由于博客使用正则搜索,为避免冲突,这里多写了一个转义符号)

data['薪资'] = data['薪资'].str.findall(reg_num)  # 过滤只剩数字(str类型的数字)
average_salary = []
for i in data['薪资']:
    salary_list = [int(j) for j in i]  # 转为int类型,并存入list
    average = salary_list[0] + 0.24 * (salary_list[1] - salary_list[0])
    average_salary.append(average)
data['薪资'] = average_salary
- 工作年限数据清洗:有数字的取中间值,应届或者不限以及其他的取0
1
2
3
4
5
6
7
8
9
10
11
data['工作年限'] = data['工作年限'].str.findall(reg_num)
average_exp = []
for i in data['工作年限']:
    if len(i) == 0:
        average_exp.append(0)
    elif len(i) == 1:
        average_exp.append(int("".join(i)))
    else:
        exp_list = [int(j) for j in i]
        average_exp.append((exp_list[0]+exp_list[1])/2)
data['工作年限'] = average_exp
- 规模数据清洗:有数字的取中间值,没有数字的统一”50”
1
2
3
4
5
6
7
8
9
10
11
12
13
14
15
data['规模'] = data['规模'].str.findall(reg_num)
average_scale = []
for i in data['规模']:
    if len(i) == 0:
        average_scale.append(50)
    elif len(i) == 1:
        average_scale.append(int("".join(i)))
    else:
        scale_list = [int(j) for j in i]
        average_scale.append((scale_list[0]+scale_list[1])/2)
data['规模'] = average_scale

file2_name = "机器学习算法_成都_清洗后.csv"
data.to_csv(file2_name)
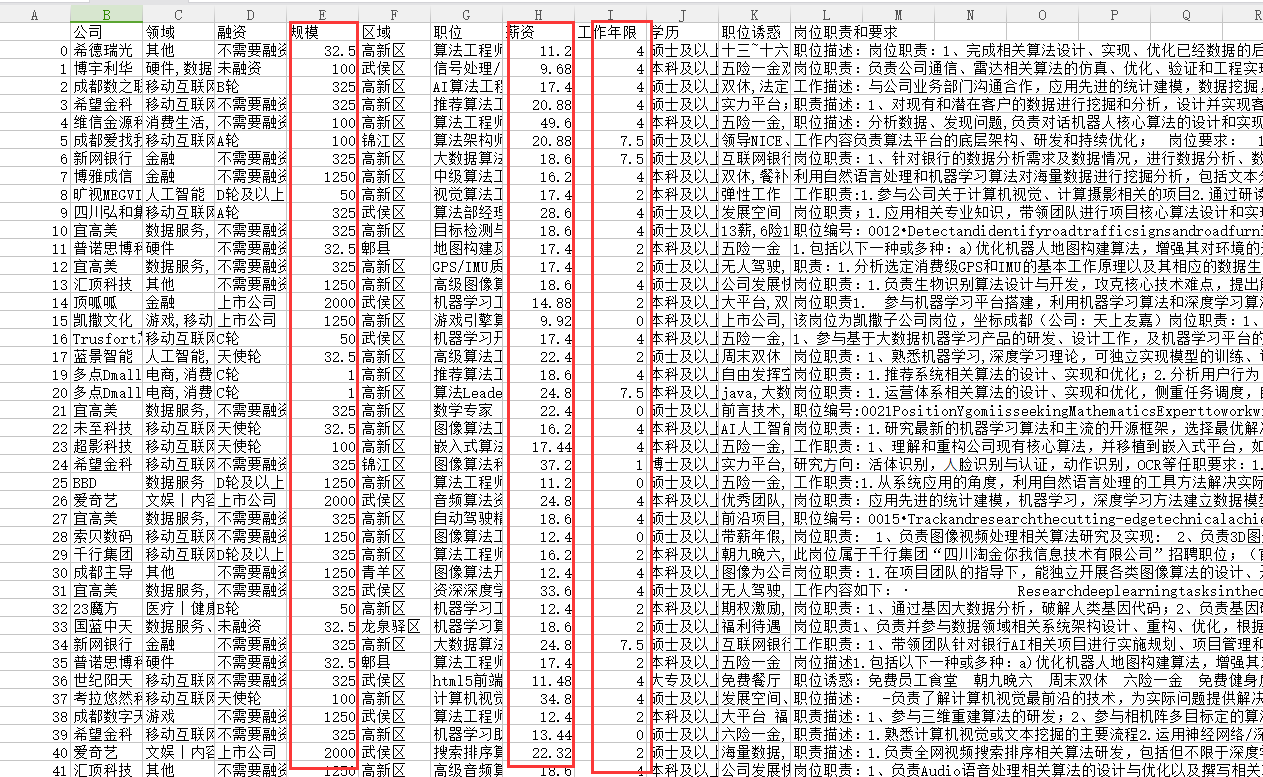
- 输出结果

数据分析部分解析
1
2
3
4
5
6
from wordcloud import WordCloud
import jieba
import jieba.analyse
import pandas as pd
import matplotlib.pyplot as plt
import seaborn as sns
- 定义词云分析并展示,将结果保存至图片
1
2
3
4
5
6
7
8
9
def wordcloud_analyze_show(data, output_name):
    words = jieba.cut(data, cut_all=True)
    words = " ".join(words)
    wc = WordCloud(font_path="simhei.ttf", collocations=False, width=1024, height=768, max_words=100)
    result = wc.generate(words)
    plt.imshow(result)
    plt.axis("off")
    plt.show()
    wc.to_file(output_name+".png")
- 读取数据
1
2
3
file_name = "机器学习算法_成都_清洗后"

data = pd.read_csv(file_name + ".csv")
- 对“岗位要求”列的数据进行数据整合和清洗,再进行词云分析
1
2
3
4
5
6
7
8
9
10
11
# 设定输出图形的大小
plt.rcParams['figure.figsize'] = (15, 10)

position_detail = data['岗位职责和要求']
position_detail_text = "".join(position_detail)
position_detail_text = position_detail_text.replace("职位描述", "").replace("任职要求", "").replace(
    ":", "").replace("岗位职责", "").replace(":", "").replace(" ", "").replace("、", "").replace(".", "").replace("·", "")
for i in range(10):
    position_detail_text = position_detail_text.replace(str(i), "")

wordcloud_analyze_show(position_detail_text, "岗位职责和要求")

- 对“职位诱惑”列的数据进行词云分析
1
2
advantages = " ".join(data["职位诱惑"])
wordcloud_analyze_show(advantages, "职位诱惑")

- 对薪资进行统计分析
1
2
3
4
5
6
# 设定输出图形的大小
plt.rcParams['figure.figsize'] = (15, 8)

sns.set(font='SimHei', style="white", palette="pastel", color_codes=True)
sns.distplot(data["薪资"])
sns.despine(left=True)

- 将“学历”和薪资联合进行关联分析
1
2
sns.stripplot(x="学历", y="薪资", data=data)
sns.despine(left=True)

- 将“区域”和薪资联合进行关联分析
1
2
sns.stripplot(x="区域", y="薪资", data=data)
sns.despine(left=True)

- 将“工作年限”和薪资联合进行关联分析
1
2
sns.stripplot(x="工作年限", y="薪资", data=data)
sns.despine(left=True)

完整代码
数据清洗
1
2
3
4
5
6
7
8
9
10
11
12
13
14
15
16
17
18
19
20
21
22
23
24
25
26
27
28
29
30
31
32
33
34
35
36
37
38
39
40
41
42
43
44
45
46
47
48
import pandas as pd

def main():
    file_name = "机器学习算法_成都.csv"
    data = pd.read_csv(file_name)
    data.drop(data[data["职位"].str.contains("实习")].index, inplace=True)  # 删除实习岗位

    # 工资数据清洗
    reg_num = '\\d+'  # 匹配数字正则表达式(由于博客使用正则搜索,为避免冲突,这里多写了一个转义符号)
    data['薪资'] = data['薪资'].str.findall(reg_num)  # 过滤只剩数字(str类型的数字)
    average_salary = []
    for i in data['薪资']:
        salary_list = [int(j) for j in i]  # 转为int类型,并存入list
        average = salary_list[0] + 0.24 * (salary_list[1] - salary_list[0])
        average_salary.append(average)
    data['薪资'] = average_salary

    # 工作年限数据清洗
    data['工作年限'] = data['工作年限'].str.findall(reg_num)
    average_exp = []
    for i in data['工作年限']:
        if len(i) == 0:
            average_exp.append(0)
        elif len(i) == 1:
            average_exp.append(int("".join(i)))
        else:
            exp_list = [int(j) for j in i]
            average_exp.append((exp_list[0]+exp_list[1])/2)
    data['工作年限'] = average_exp

    # 规模数据清洗
    data['规模'] = data['规模'].str.findall(reg_num)
    average_scale = []
    for i in data['规模']:
        if len(i) == 0:
            average_scale.append(200)
        elif len(i) == 1:
            average_scale.append(int("".join(i)))
        else:
            scale_list = [int(j) for j in i]
            average_scale.append((scale_list[0]+scale_list[1])/2)
    data['规模'] = average_scale

    file2_name = "机器学习算法_成都_清洗后.csv"
    data.to_csv(file2_name)

main()
数据分析
1
2
3
4
5
6
7
8
9
10
11
12
13
14
15
16
17
18
19
20
21
22
23
24
25
26
27
28
29
30
31
32
33
34
35
36
37
38
39
40
41
42
43
44
45
46
47
48
49
50
51
52
from wordcloud import WordCloud
import jieba
import jieba.analyse
import pandas as pd
import matplotlib.pyplot as plt
import seaborn as sns

def wordcloud_analyze_show(data, output_name):
    words = jieba.cut(data, cut_all=True)
    words = " ".join(words)
    wc = WordCloud(font_path="simhei.ttf", collocations=False, width=1024, height=768, max_words=100)
    result = wc.generate(words)
    plt.imshow(result)
    plt.axis("off")
    plt.show()
    wc.to_file(output_name+".png")

def main():
    file_name = "机器学习算法_成都_清洗后"
    data = pd.read_csv(file_name + ".csv")
    # 设定输出图形的大小
    plt.rcParams['figure.figsize'] = (15, 10)

    position_detail = data['岗位职责和要求']
    position_detail_text = "".join(position_detail)
    position_detail_text = position_detail_text.replace("职位描述", "").replace("任职要求", "")     .replace(":", "").replace("岗位职责", "").replace(":", "").replace(" ", "").replace("、",    "").replace(".", "").replace("·", "")
    for i in range(10):
        position_detail_text = position_detail_text.replace(str(i), "")

    # 输出岗位职责和要求的词云图
    wordcloud_analyze_show(position_detail_text, "岗位职责和要求")
    # 输出岗位职责和要求的词云图
    advantages = " ".join(data["职位诱惑"])
    wordcloud_analyze_show(advantages, "职位诱惑")
    # 设定输出图形的大小
    plt.rcParams['figure.figsize'] = (15, 8)
    # 对薪资进行统计分析
    sns.set(font='SimHei', style="white", palette="pastel", color_codes=True)
    sns.distplot(data["薪资"])
    sns.despine(left=True)
    # 将“学历”和薪资联合进行关联分析
    sns.stripplot(x="学历", y="薪资", data=data)
    sns.despine(left=True)
    # 将“区域”和薪资联合进行关联分析
    sns.stripplot(x="区域", y="薪资", data=data)
    sns.despine(left=True)
    # 将“工作年限”和薪资联合进行关联分析
    sns.stripplot(x="工作年限", y="薪资", data=data)
    sns.despine(left=True)

main()